A useful first test before the measurement equipment arrives
Before buying a calibrated sound-level meter and acoustic calibrator, we wanted to answer a simpler engineering question: does our microphone pipeline respond sensibly to different sounds and levels, and how far is its scale from a documented reference app?
We used the NIOSH Sound Level Meter app because its testing is documented. NIOSH reports accuracy within ±2 dBA in its laboratory testing and Type 2 performance with a calibrated external microphone. Those claims belong to the tested NIOSH system; our comparison does not transfer them to Lullasure. NIOSH app documentation.
The founder ran this experiment at home using a laptop, a Creative Pebble speaker and one iPhone. We are publishing the substantial original error along with the improvement, so later equipment-based reports have a clear starting point.
September 9 update: a new run of the corrected app
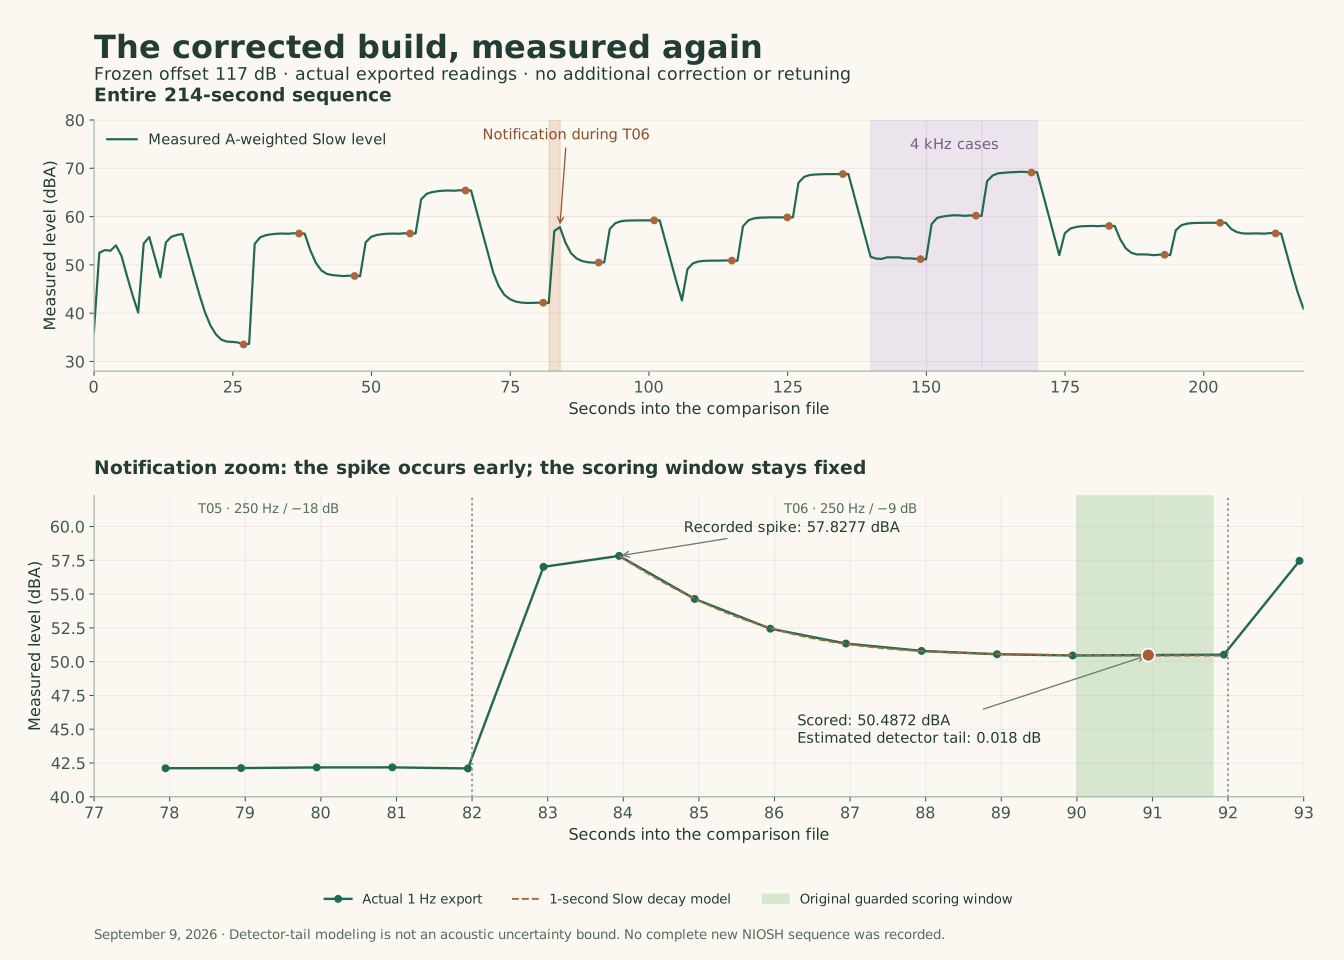
Later the same day, we installed the corrected development build and recorded a new 227-sample Laboratory experiment. Every exported sample used calibration version niosh-comparison-2026-09-09-v1 and the 117 dB conversion constant. We kept the +23.0 dB correction fixed throughout this analysis; these are new on-device readings, with no additional offset fitted or added afterward.
The new screen recording opens with a NIOSH pink-noise setup check around 65.4 dBA, followed by the Lullasure run. It does not contain a new full NIOSH tone sequence. The comparisons in this update therefore use the original NIOSH reference readings. A stable pink-noise setup check cannot establish that every frequency reached the phone at exactly the same level in both sessions.
The three reserved sounds differ from the earlier NIOSH readings by at most 0.37 dB, with a root-mean-square difference of 0.28 dB. Across the original set of 16 retained conditions, including repeats, the root-mean-square difference is 0.81 dB and the largest absolute difference is 1.91 dB. The first and final repeated pink-noise readings differ by only 0.02 dB.
The largest differences are the three 4 kHz tones, now 1.61–1.91 dB below the earlier NIOSH readings. They also sit about 0.82–0.89 dB below the first run after its offline correction. This pattern needs a fresh full NIOSH pass before we attribute it to the app or fit a frequency correction. The broad 23 dB scale correction remains useful; it has not established uniform accuracy.
The operator reported a computer notification, and a matching meter excursion appears approximately 83–84 seconds into playback, near the start of the middle-volume 250 Hz tone. The exported Slow level peaked at 57.83 dBA, then settled to 50.49 dBA at the scheduled scoring sample. We used the original late scoring window, rather than moving it to a favorable value. A simple one-second Slow-decay model estimates about a 0.02 dB residual effect on the scored level. As a conservative check, excluding the entire disturbed condition changes the overall root-mean-square difference from 0.81 to 0.82 dB; the worst difference remains 1.91 dB.
The notification remains in the saved measurements. It affects the rolling maximum and rolling energy average beyond the visible live spike, so those metrics were not substituted for the scheduled Slow reading. The new video’s audio track is silent; the export and visible meter trace provide the transient evidence.
Download the confirmation readings and machine-readable results. The original data below remains available unchanged.
| Condition | Earlier NIOSH | New Lullasure | Difference |
|---|---|---|---|
| Pink noise, top level | 65.3 | 65.40 | +0.10 |
| White noise · reserved | 57.7 | 58.07 | +0.37 |
| Brown noise · reserved | 52.1 | 52.09 | −0.01 |
| Three-tone mix · reserved | 58.4 | 58.72 | +0.32 |
| 4 kHz, lowest level | 53.1 | 51.19 | −1.91 |
Original experiment: one speaker, one phone, two runs
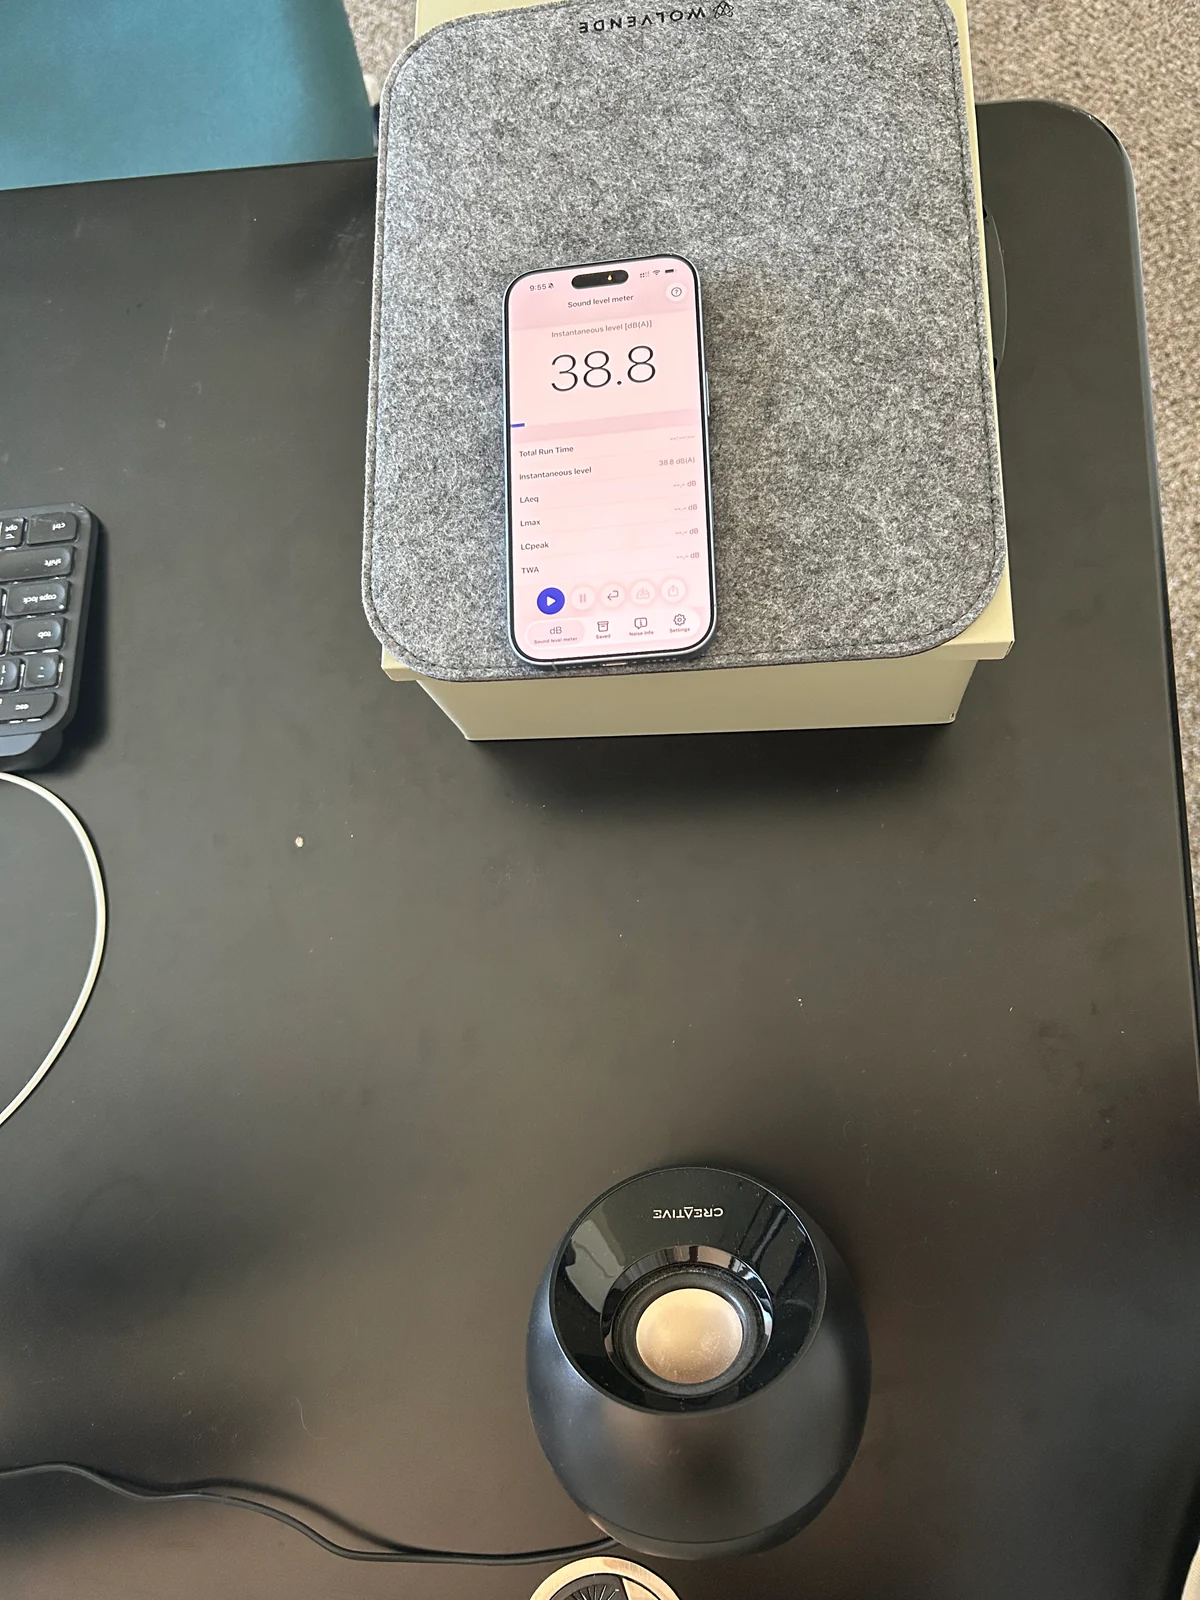
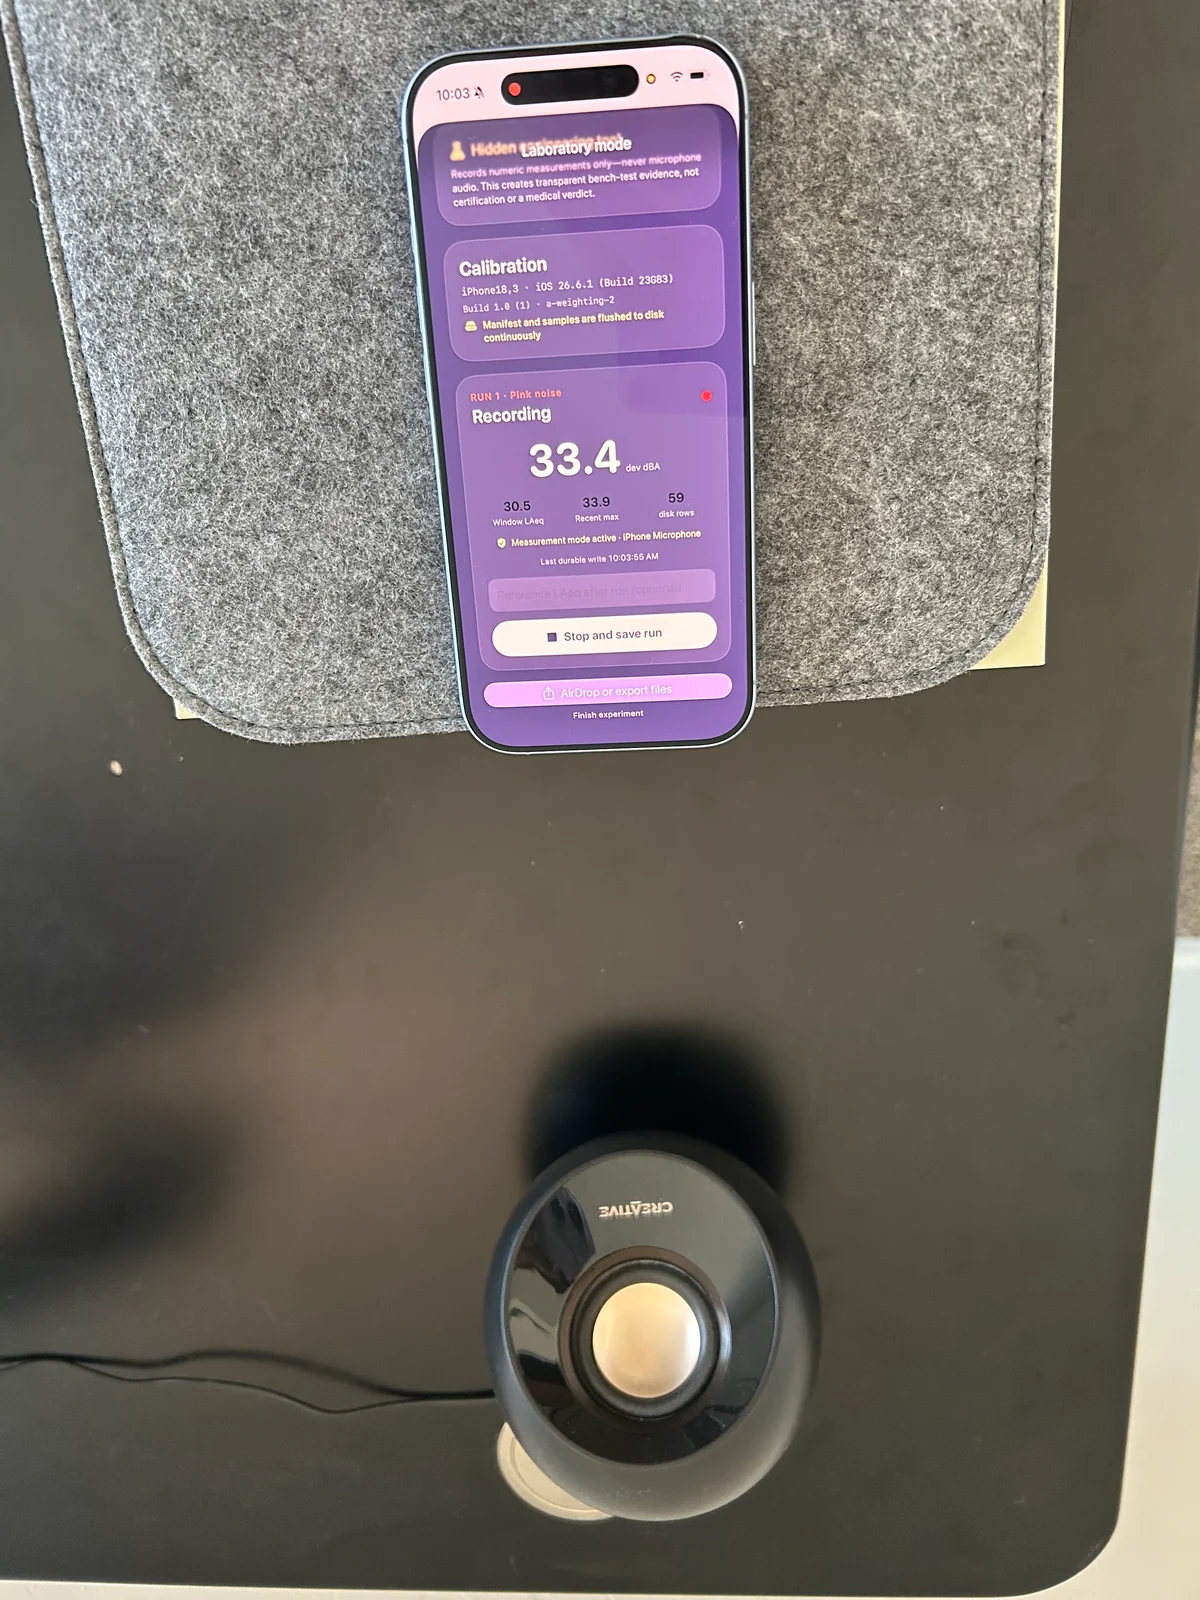
The laptop played the same prepared file through one speaker channel. The phone rested face up on a pad and box, with its bottom edge facing the speaker. We kept the placement and playback volume fixed, first measuring with NIOSH and then with Lullasure’s Laboratory screen. The same phone therefore sampled the two runs sequentially.
Pink setup noise was adjusted to about 65 dBA in NIOSH before the sequence. The operator returned to NIOSH afterward and reported 65.2–65.4 dBA on the setup noise. That final check is a useful report of output stability; it is not a recorded measurement from the main video.
The inexpensive speaker was adequate for this limited comparison because both apps heard the same replayed source at the same position. Its frequency response, distortion and the room still limit the experiment. We did not assume that equal digital levels produced equal acoustic levels at different frequencies.
| Detail | This experiment |
|---|---|
| Phone and system | One physical iPhone; hardware identifier iPhone18,3; iOS 26.6.1 |
| Lullasure | Version 1.0, build 1; engine a-weighting-2; built-in microphone; measurement audio-session mode |
| Meter setting | Current A-weighted level with Slow time weighting in both runs |
| Saved evidence | One screen recording, six setup photos, and a 224-row Laboratory export at approximately 1 Hz |
| Distance | Export form says 100 cm; no ruler or independent distance verification is visible |
| Unrecorded details | NIOSH app version and any existing calibration adjustment were not captured |
Different frequencies, different levels, and sounds held back
The 214-second file included a synchronization pattern, a background interval, and 17 ten-second sound intervals. Pink noise and tones at 250 Hz, 1 kHz and 4 kHz were each played at digital levels of −18, −9 and 0 dB relative to the file’s top setting. These are playback-file level differences, not promised dBA levels in the room.
White noise, brown noise and a three-tone mixture were designated as holdouts before analysis: their readings did not choose the correction. Repeated pink-noise intervals checked whether the setup drifted. Ten-second plateaus allowed the Slow display to settle; we scored near their ends rather than averaging across transitions.
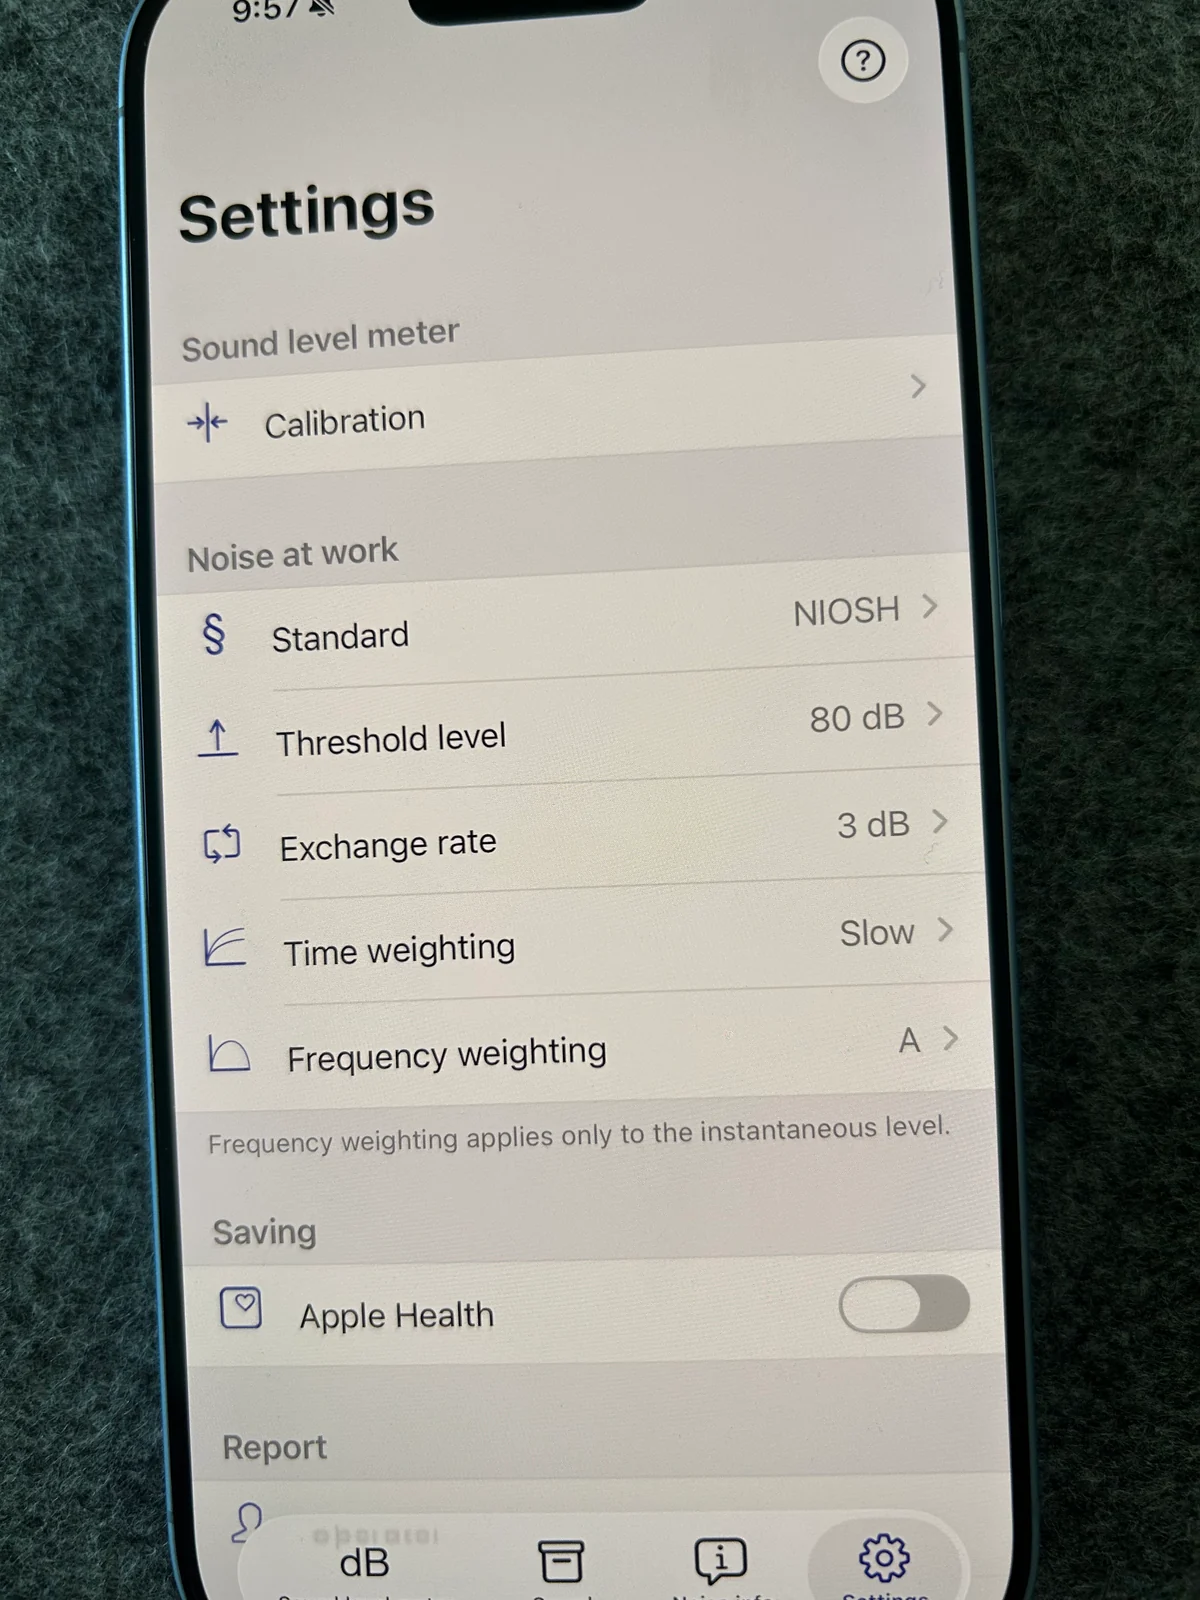
The photographs confirm NIOSH’s A and Slow settings. Its occupational threshold and dose settings were not the measurement being compared: we used the current sound-level display.
How we matched the recording to the exported readings
We made contact sheets at three frames per second, found the synchronization pattern and checked the sound plateaus. The NIOSH sequence begins approximately 34 seconds into the video. The recording’s audio track is silent, so onset was inferred from the visible meter transitions rather than from a captured waveform.
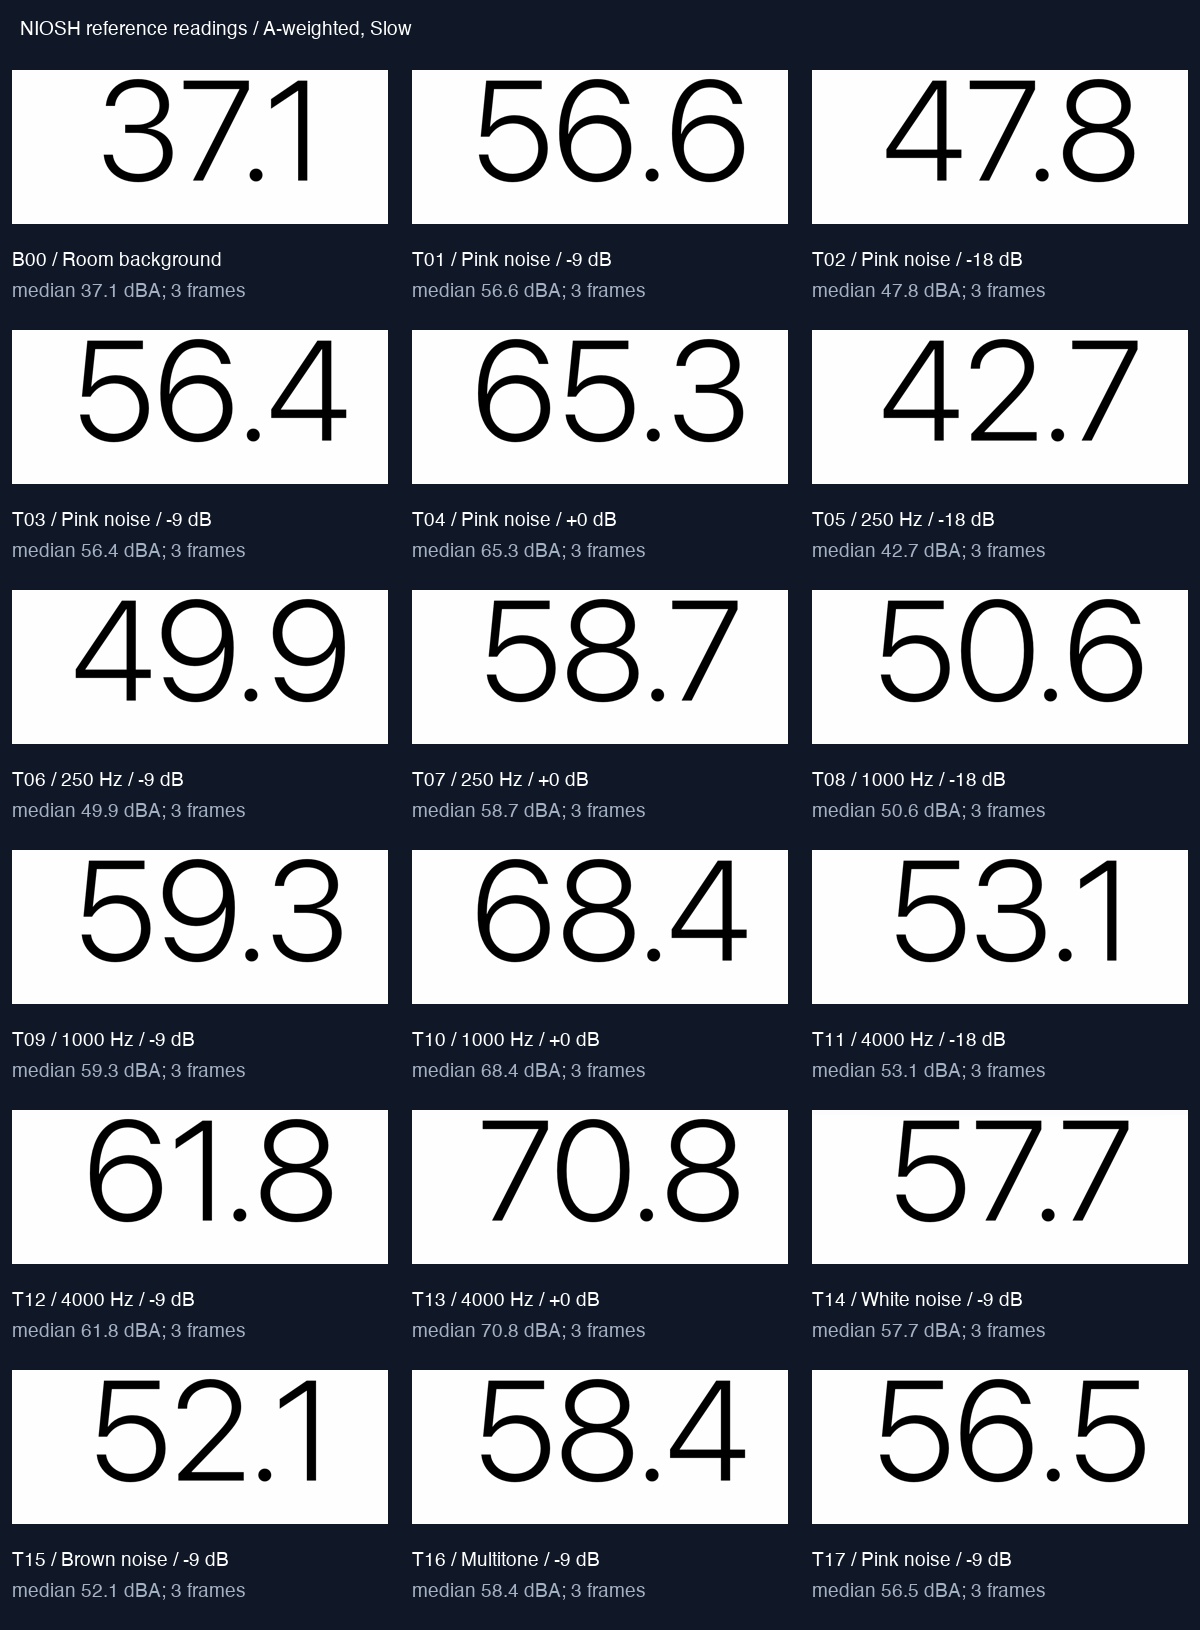
For each NIOSH condition, we visually verified three late-window frames and took the median displayed value. For Lullasure, matching the exported transitions places playback about 6.14 seconds after the Laboratory run began. Each guarded scoring window, from 8.0 to 9.8 seconds into a sound, contains one actual exported sample. We used that sample without interpolating extra readings.
Using the full final two seconds instead changes the Lullasure value by at most 0.073 dB across the active sound conditions. This timing sensitivity is small compared with the original 23 dB discrepancy. It does not quantify absolute microphone accuracy.
Inspect the clean NIOSH contact sheet or download every paired condition. The public data includes the excluded condition and background, so the selection is visible.
The result: fix the scale before adding complexity
The original development profile converted the weighted digital level to an estimated acoustic level by adding 94 dB. That was a starting constant, not a measured calibration for this phone. Across the eleven accepted fitting conditions, NIOSH minus Lullasure averaged 22.990 dB. We rounded the correction to +23.0 dB, giving a provisional conversion constant of 117.0 dB.
We fitted one additive offset with equal weight per accepted condition. A constant offset has a direct least-squares solution, so an iterative optimizer or frequency-by-frequency curve was unnecessary for this first pass.
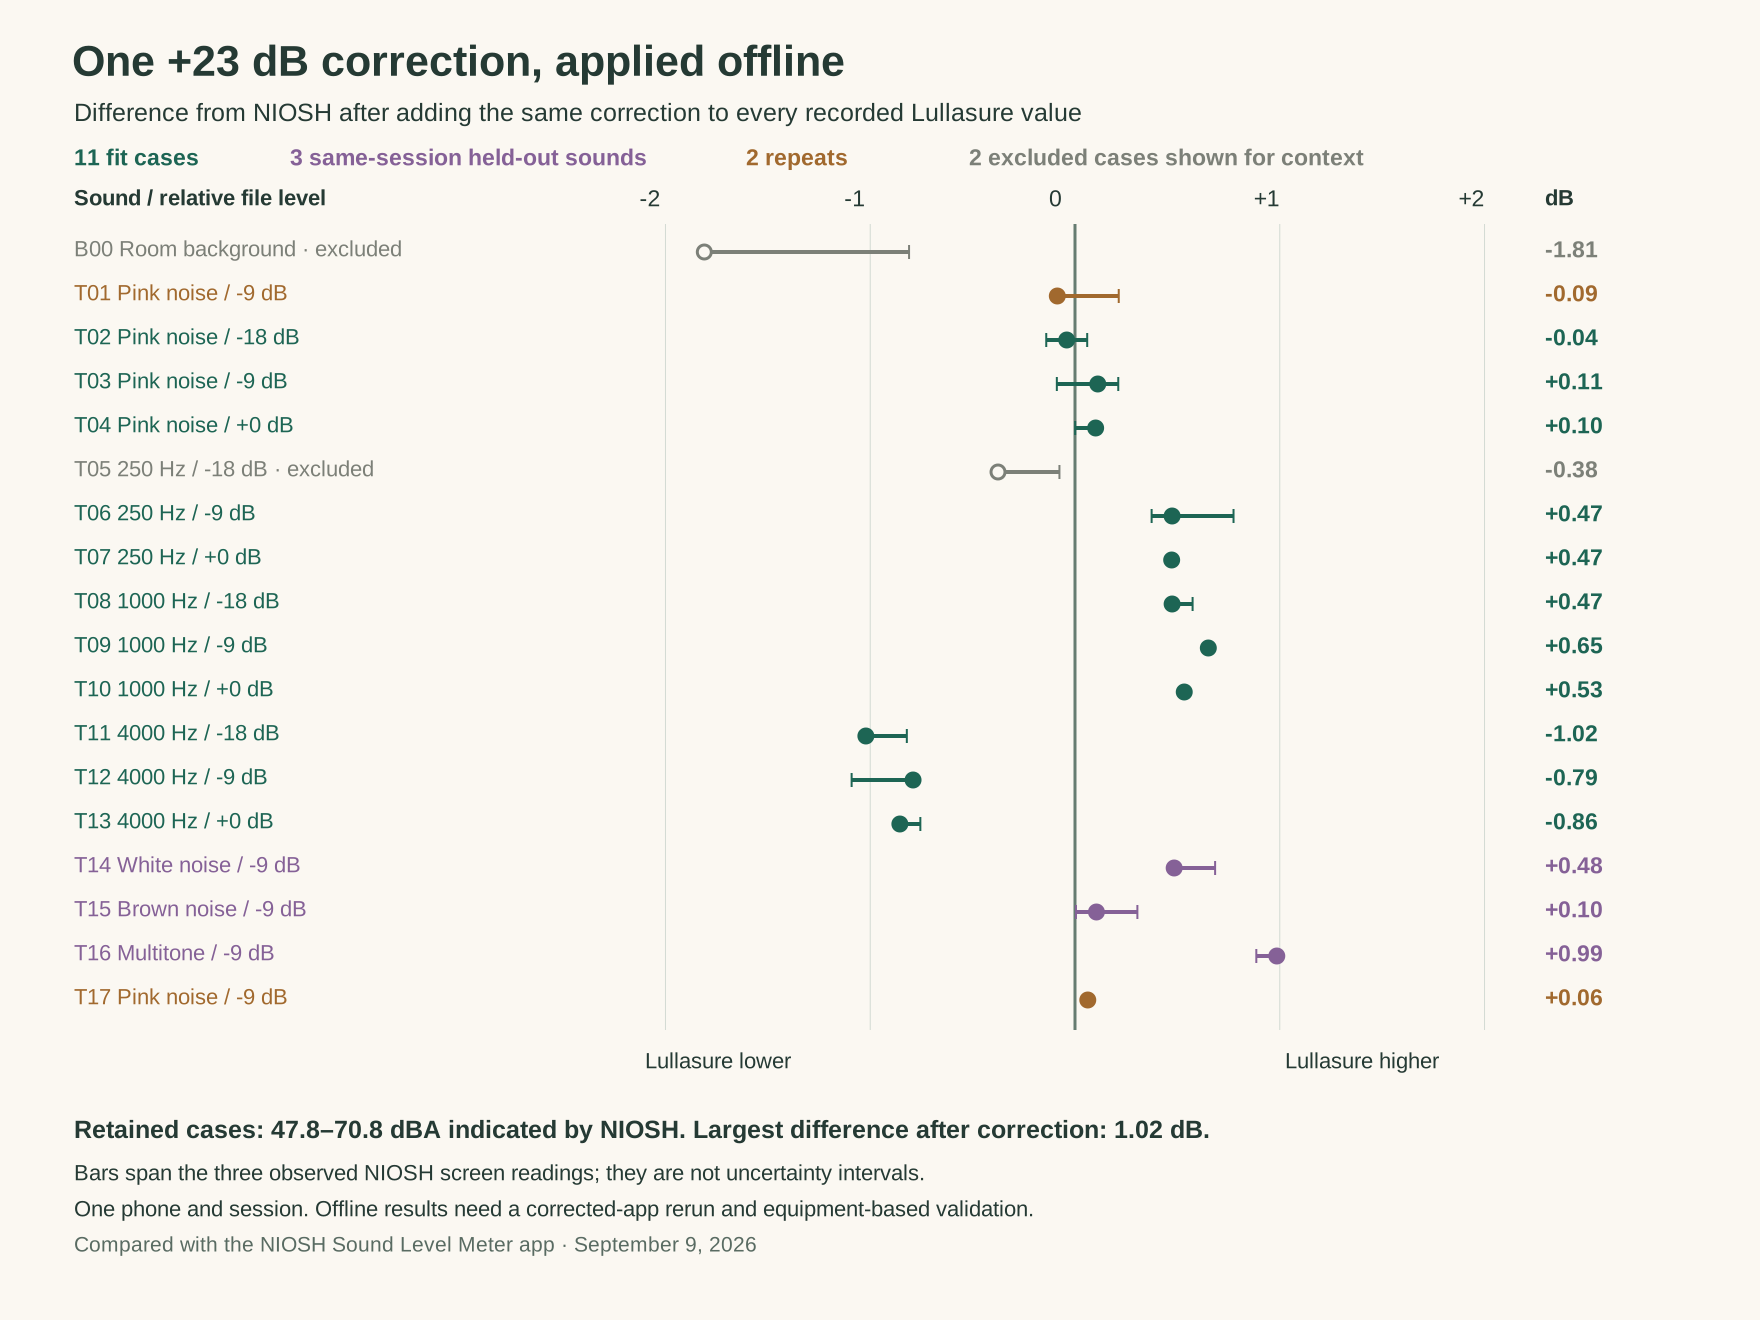
We excluded the quietest 250 Hz condition from fitting because NIOSH measured it only 5.6 dB above the recorded background, below the 10 dB margin used for this analysis. Background and the repeat checks also did not determine the offset. The accepted fitting readings span 47.8–70.8 dBA in NIOSH.
With +23.0 dB applied offline, the fitting conditions have a root-mean-square difference of 0.59 dB and a largest absolute difference of 1.02 dB (rounded). The three held-out sounds have a root-mean-square difference of 0.64 dB and a largest difference of 0.99 dB. These are differences from NIOSH in this session, not a calibrated uncertainty specification. The remaining 4 kHz underreadings, about 0.8–1.0 dB, show that the single offset has not removed every frequency-dependent difference.
| Condition | NIOSH | Original | After +23 | Difference |
|---|---|---|---|---|
| Pink, −18 dB · fit | 47.8 | 24.76 | 47.76 | −0.04 |
| Pink, 0 dB · fit | 65.3 | 42.40 | 65.40 | +0.10 |
| 4 kHz, −18 dB · fit | 53.1 | 29.08 | 52.08 | −1.02 |
| White noise · held out | 57.7 | 35.18 | 58.18 | +0.48 |
| Brown noise · held out | 52.1 | 29.20 | 52.20 | +0.10 |
| Three-tone mix · held out | 58.4 | 36.39 | 59.39 | +0.99 |
| 250 Hz, −18 dB · excluded | 42.7 | 19.32 | 42.32 | −0.38 |
Every condition, including the exclusions
The plot shows the remaining difference after the same correction is applied to every saved value. Its bars span the three observed NIOSH readings; they are not confidence or acoustic uncertainty intervals.
The repeated sounds stayed close
NIOSH’s three repeated pink-noise readings were 56.6, 56.4 and 56.5 dBA, a total span of 0.2 dB. Lullasure’s final pink-noise reading differed from its first by about 0.05 dB. Together with the operator’s final 65.2–65.4 dBA setup check, these observations support treating the session as reasonably stable.
They do not make the runs simultaneous. A changing room background or an unnoticed interruption could still affect the two apps differently, particularly in the quietest condition.
What this changes in Lullasure
Build 2 status — September 9, 2026. Version 1.0 (build 2) uses a provisional 117 dB conversion constant for Check across device models and a separate, uncalibrated 94 dB baseline for Track. The Check correction was not suitable for Track’s playback-compatible audio mode. Both profiles remain unverified; the interface shows uncalibrated estimates and withholds absolute suitability labels. This implementation update does not refit the saved experiment, establish accuracy, or change any original result published here.
Earlier development status on September 9, 2026: the measured comparison applied to the tested hardware identifier and iOS version, using the built-in microphone in Check and Laboratory’s measurement mode. Track provisionally inherited the same +23 dB correction on that hardware and iOS version while retaining its playback-compatible default audio mode. That transfer was an engineering estimate: Track was not measured in this experiment, and the agreement figures above did not apply to it. Other phone models and system versions did not inherit that profile.
The profile remains unvalidated: it has no certified level range or instrument-based uncertainty. Testing one physical unit also cannot establish how other units of the same model behave. The dated update above records the first run of the corrected build; the original “after +23” table remains an offline recalculation of the first export.
We are correcting the conversion scale, while keeping the digital A-weighting and time-weighting calculations intact. The calibration status page separates implemented processing, this provisional comparison and the equipment validation still to come.
The next article needs an independent reference
The original comparison and its same-day corrected-app replay cover one phone, one speaker and one room. The held-out sounds were not used to choose the offset, but share that equipment. We have not established accuracy across devices, quiet nursery levels, loud transients, cases, orientations or later iOS versions. Agreement cannot rule out an error shared by both apps.
When the measurement equipment arrives, the next stage is comparison with a traceably calibrated sound-level meter, with acoustic calibrator checks before and after the session. We plan repeated runs, additional phone units, a wider level range and separate testing of Check and Track. The resulting report should show failures and underreadings alongside successful conditions.
We will link that equipment-based report back to this first comparison. Keeping the original result available makes it possible to see what changed and which claims the evidence actually supports. Until then, this is a documented engineering step toward calibration, not an endorsement by NIOSH or a hearing-safety assessment.
Common questions
Is Lullasure now calibrated or certified by NIOSH?
No. We compared two apps and estimated a provisional offset. NIOSH did not conduct, approve or endorse this experiment, and no certification follows from it.
Do the results apply to every iPhone?
No. We tested one physical phone and one recording configuration. Other devices, iOS versions and continuous Track need their own comparisons.
Why publish before the calibrated equipment arrives?
This experiment exposed a large conversion error and gives the next round of testing a documented baseline. Publishing its limitations is part of making the development process inspectable.
Sources and updates
- NIOSH Sound Level Meter app: testing and capabilities — Primary documentation for the reference app. Its validation claims do not extend to Lullasure.
- Lullasure home comparison: paired readings and selection flags — Founder-run experiment on September 9, 2026. Includes original and offline-corrected readings; not independent instrument validation.
- Machine-readable methods and results
- Corrected-build confirmation run: measurements and comparison flags — Actual corrected-app samples from a new run; the full NIOSH reference sequence is from the earlier experiment.
: September 9 follow-up: added a real corrected-build run, frozen-offset results, notification-spike analysis and the remaining 4 kHz discrepancy. Preserved the original experiment and offline calculations. No further calibration adjustment was made. A dated Build 2 note now distinguishes the current Check and Track defaults from that experiment; its saved readings and results remain unchanged.
Found a problem? Send a correction with the page and source.